
Room to Grow
The Parker bills are a great start. Here's how we can level up the impact.
The Gap
We scored 6 cities on transit-oriented zoning strength. Philadelphia ranks last.
Every peer city that has adopted transit-oriented zoning goes further than the Parker bill on parking, height, density, and geographic coverage. Philadelphia’s proposal covers fewer stations, offers a smaller FAR bonus, and retains parking minimums that no other city still requires near transit.
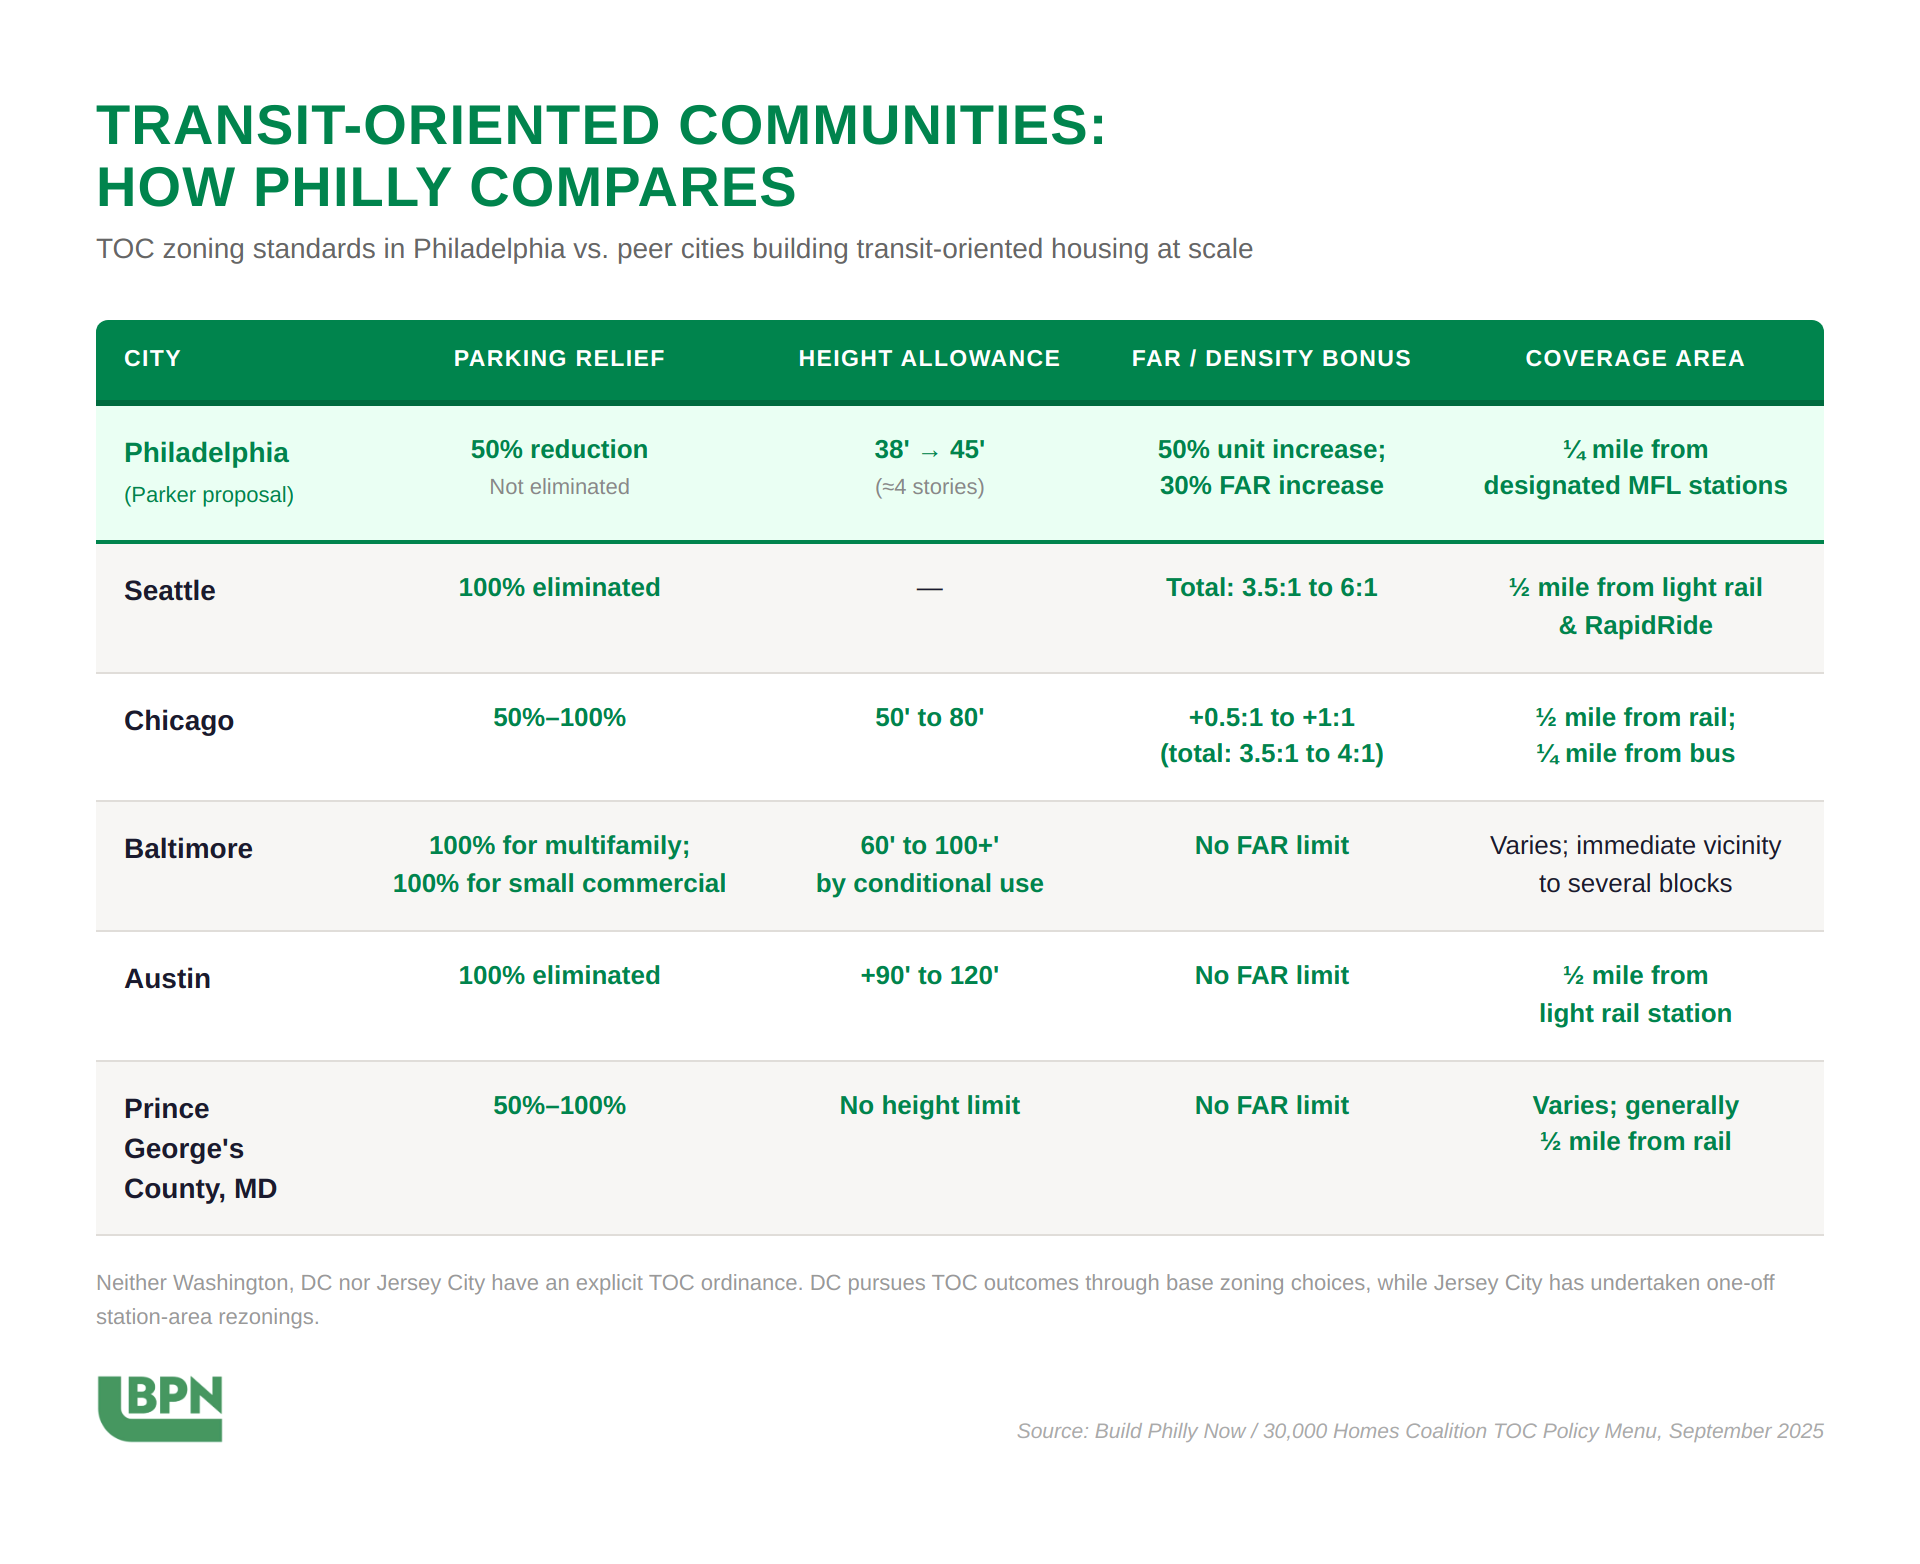
| City | Parking | Height | FAR/Density | Coverage |
|---|---|---|---|---|
| Seattle, WA | No minimums citywide | Unlimited in urban centers | 75% density bonus w/ affordability | Citywide (all frequent transit) |
| Chicago, IL | No minimums near transit | No TOD-specific caps | 50% FAR bonus | ½ mile around all CTA stations |
| Austin, TX | No minimums citywide | 60 ft near transit | Compatibility standards relaxed | ¼ mile around transit stops |
| Baltimore, MD | No minimums in TOD zones | 65 ft in transit zones | Density doubled in TOD | ½ mile around rail stations |
| Prince George's Co., MD | 50% reduction near transit | 150 ft in activity centers | Up to 8.0 FAR in activity centers | ½ mile around Metro stations |
| Philadelphia (Parker) | 50% reduction (not elimination) | 45 ft (CMX-1/2, RM-1 only) | 30% FAR bonus | ¼ mile, 13 MFL stations only |
Fix the Bonus
The 30% FAR bonus brings buildings to 9 stories — the range the construction cost study flags as least efficient.
A landmark study by Eriksen & Orlando (Real Estate Economics, 2022) shows that in 24 of the 50 largest US cities, unconstrained developers build exactly 7 stories. At 8 stories, construction costs jump 32% due to the shift from wood-frame to steel/concrete. The 30% bonus (500% × 1.3 = 650% FAR) adds about two floors, bringing buildings to 9 stories — the range the study identifies as least cost-efficient.
Construction Cost / sqft
Four Massing Scenarios
Base Zoning
Current Code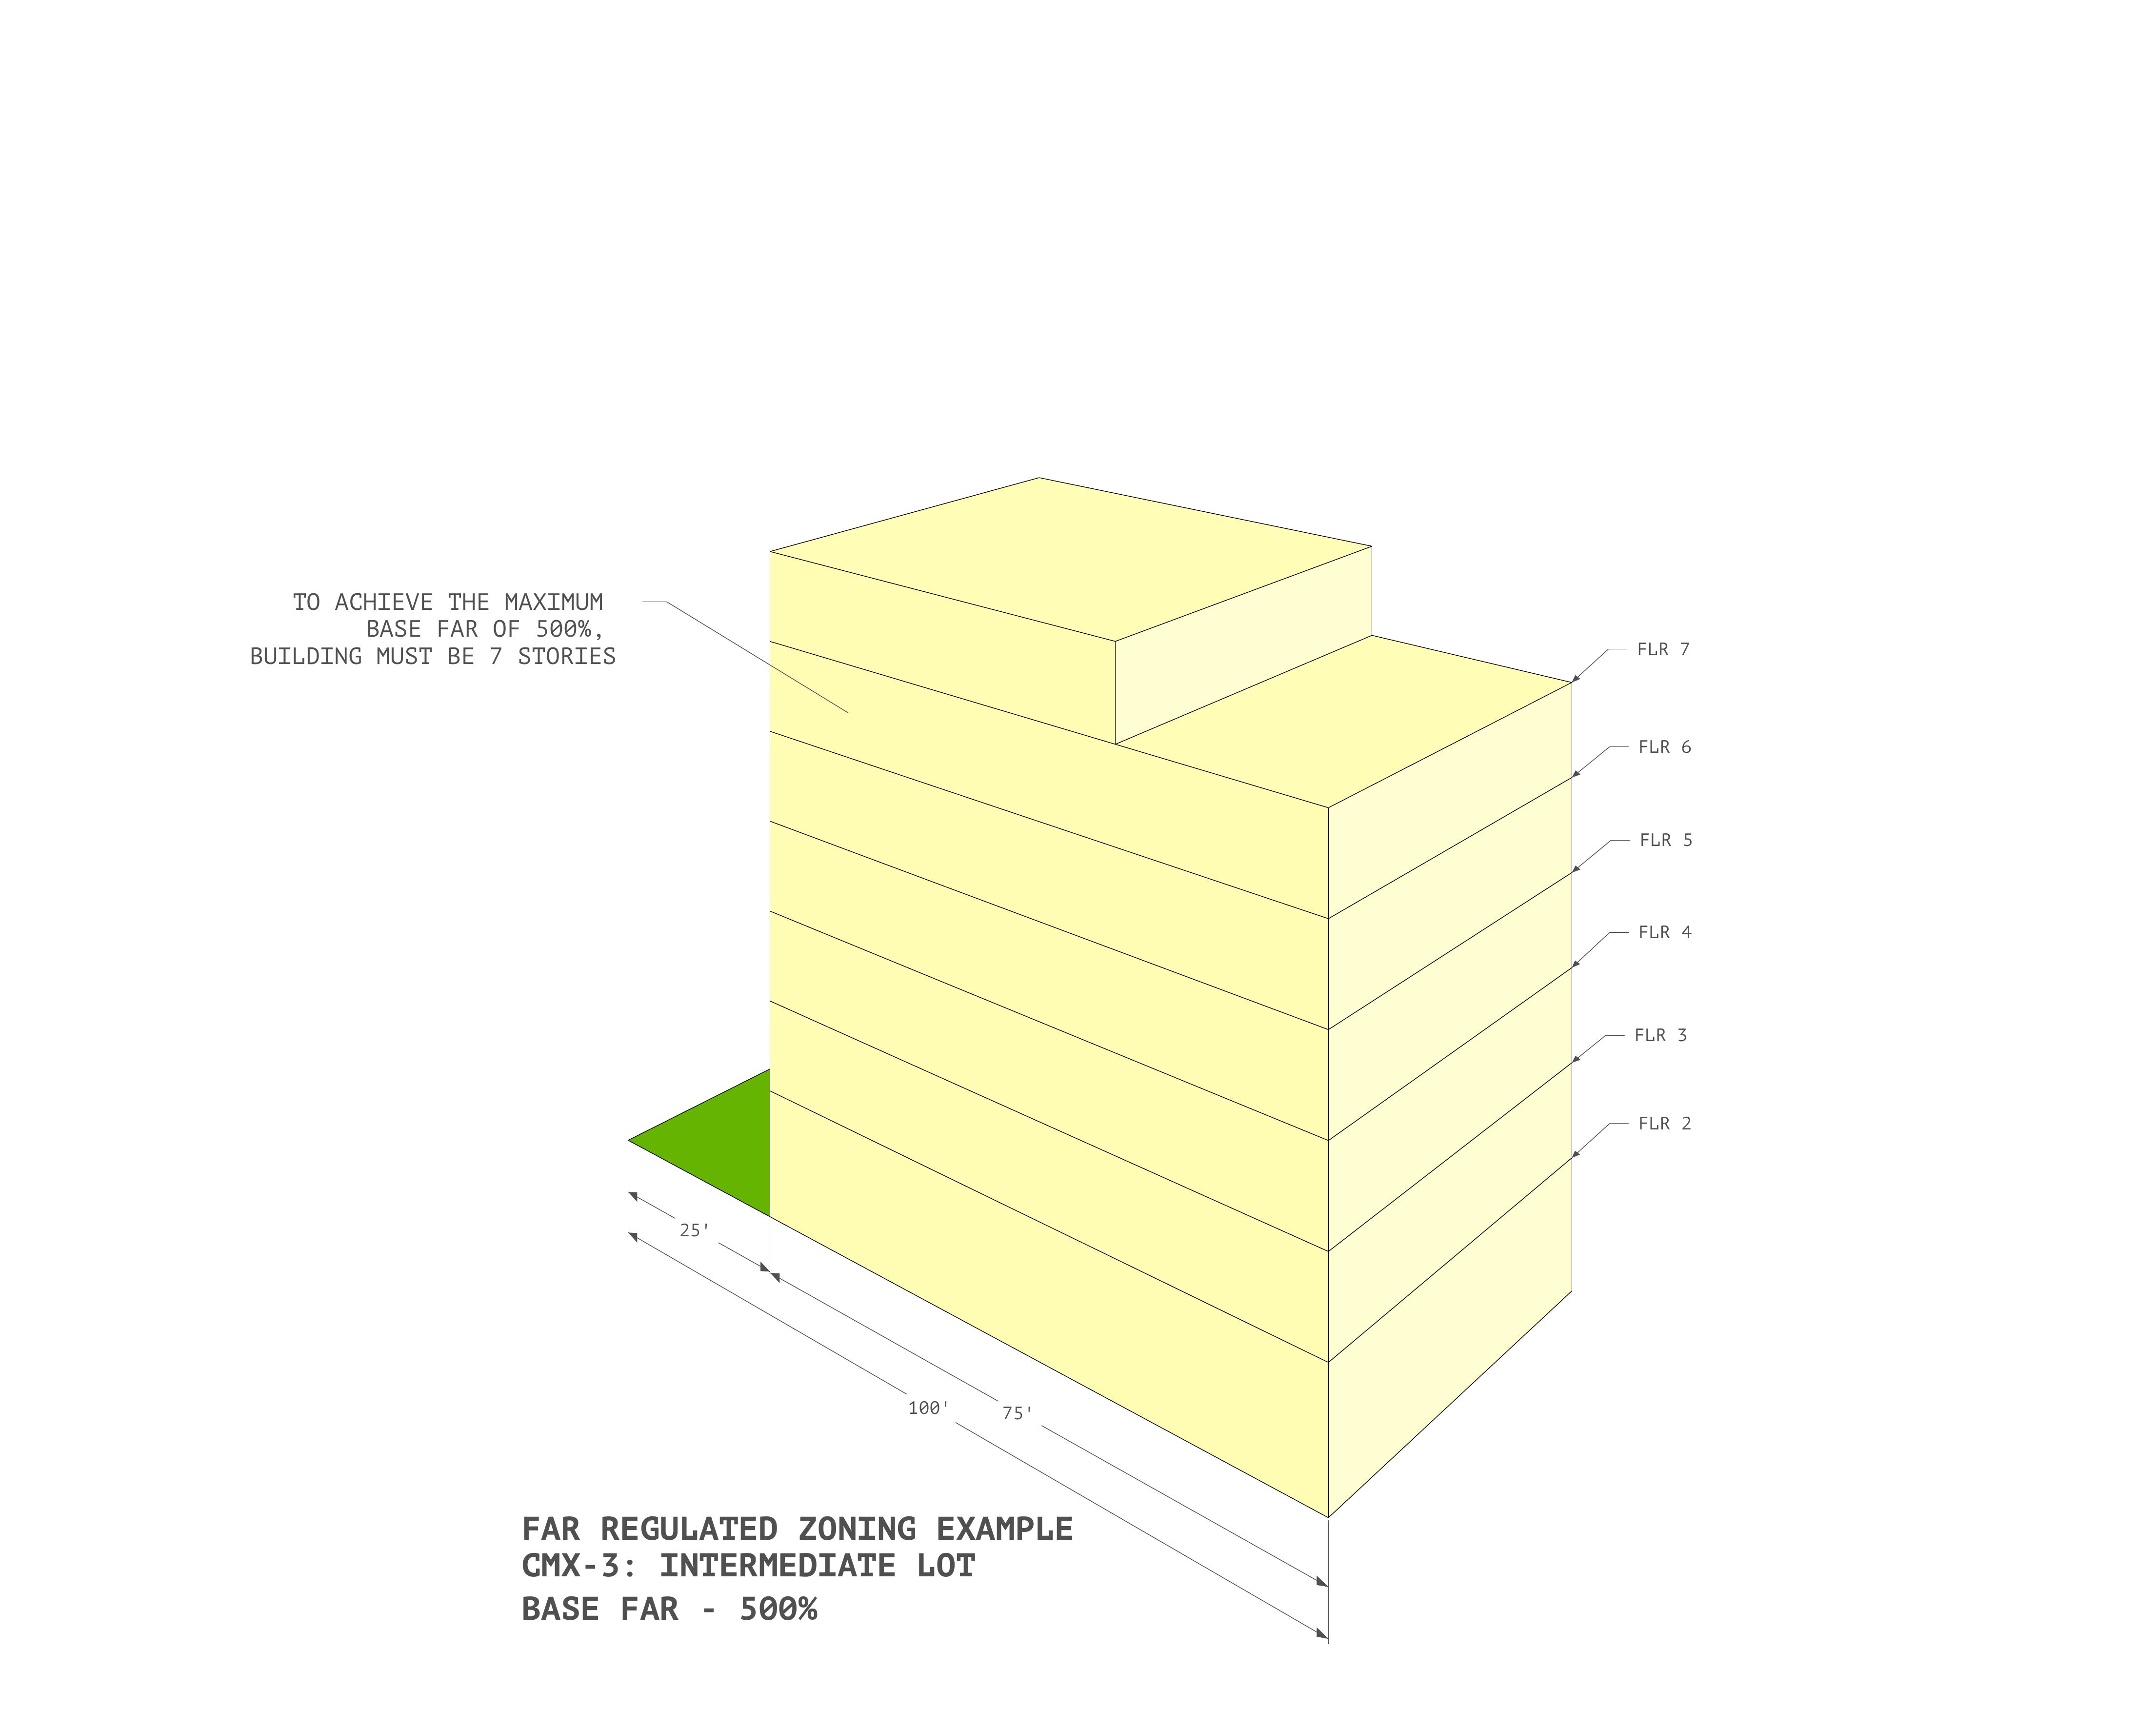
Current CMX-3 zoning allows 500% FAR with 75% lot coverage. This maxes out at 7 stories — the sweet spot for Type III/IV wood-frame construction. Most efficient construction type with lowest per-unit costs.
Parker TOC Bill
Bill 260517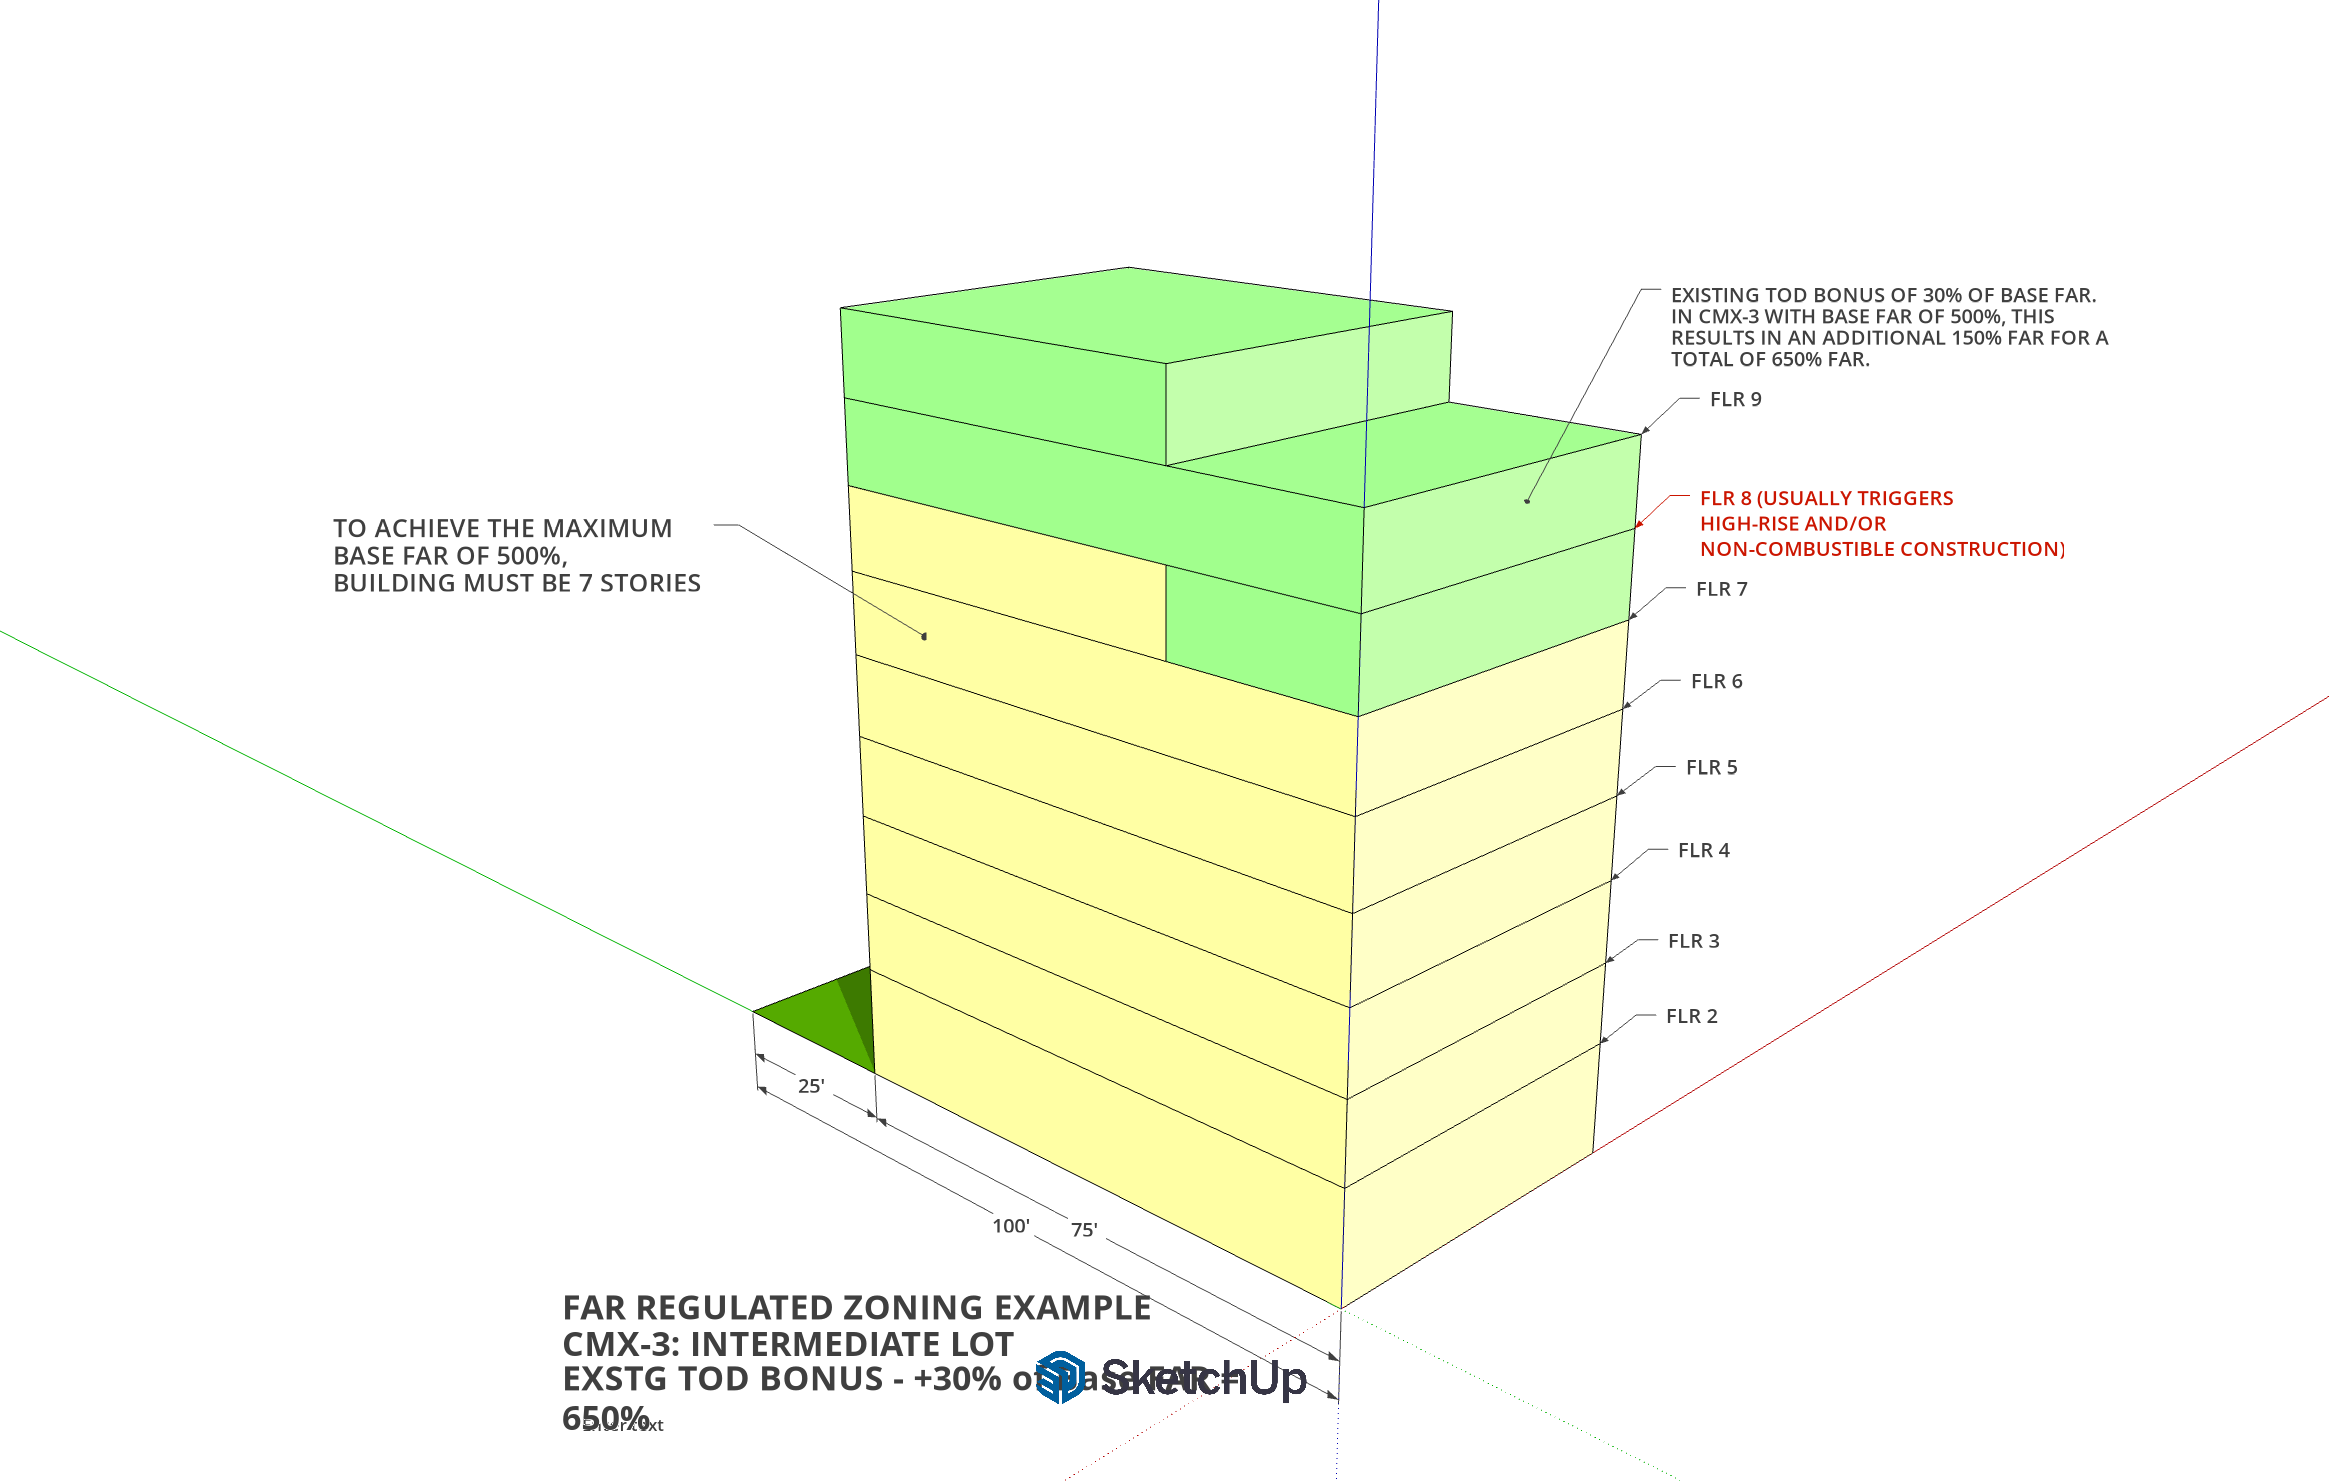
The 30% bonus is calculated on the base FAR (500% × 1.3 = 650%), adding +150% FAR — about two floors — to reach 9 stories. The cost study finds 8-9 stories is where returns are weakest: it requires Type I (steel/concrete) construction and its ~32% higher cost, while adding only modest floor area, so the added capacity is hard to build economically.
Transit Improvements Bonus
Bill 260518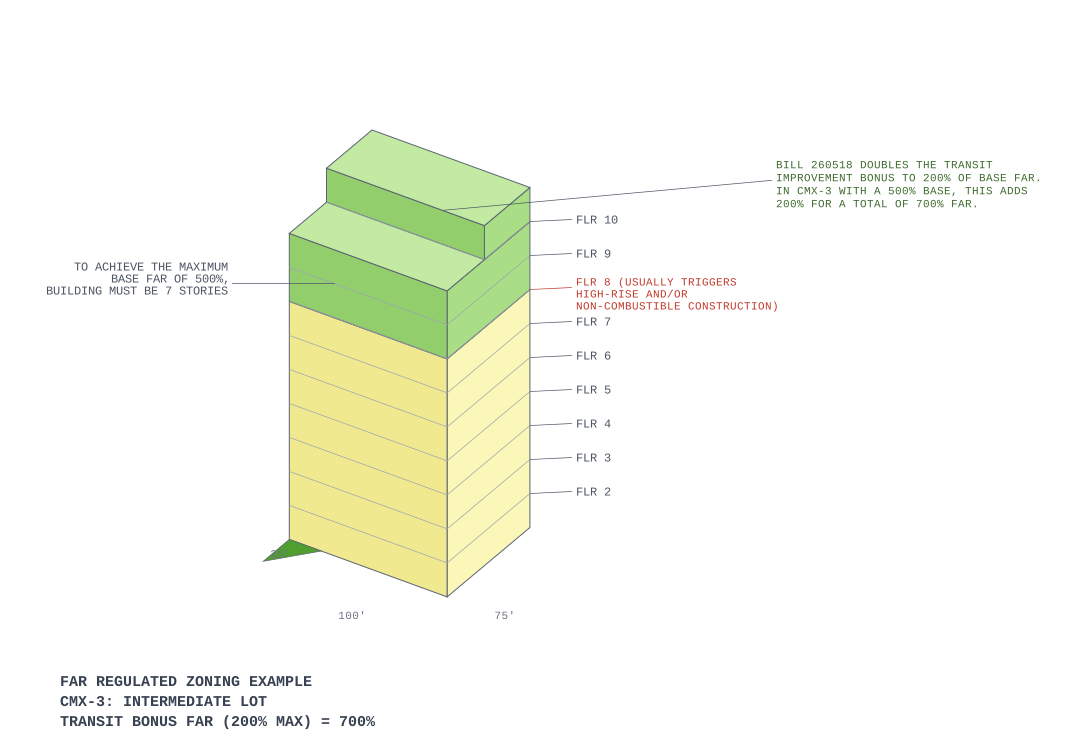
Bill 260518 doubles the transit-improvements bonus (§14-702(8)) for CMX-3 within /TOC from 100% to 200%, reaching 700% FAR (~10 stories) — rising past the steepest part of the cost cliff. This is an earned bonus: a developer claims it by spending a set share of hard costs on transit improvements. It adds no by-right capacity, and at 700% it's still short of the ~800% where Type I steel/concrete typically becomes economical on its own.
Cumulative Bonus Stacking
Recommended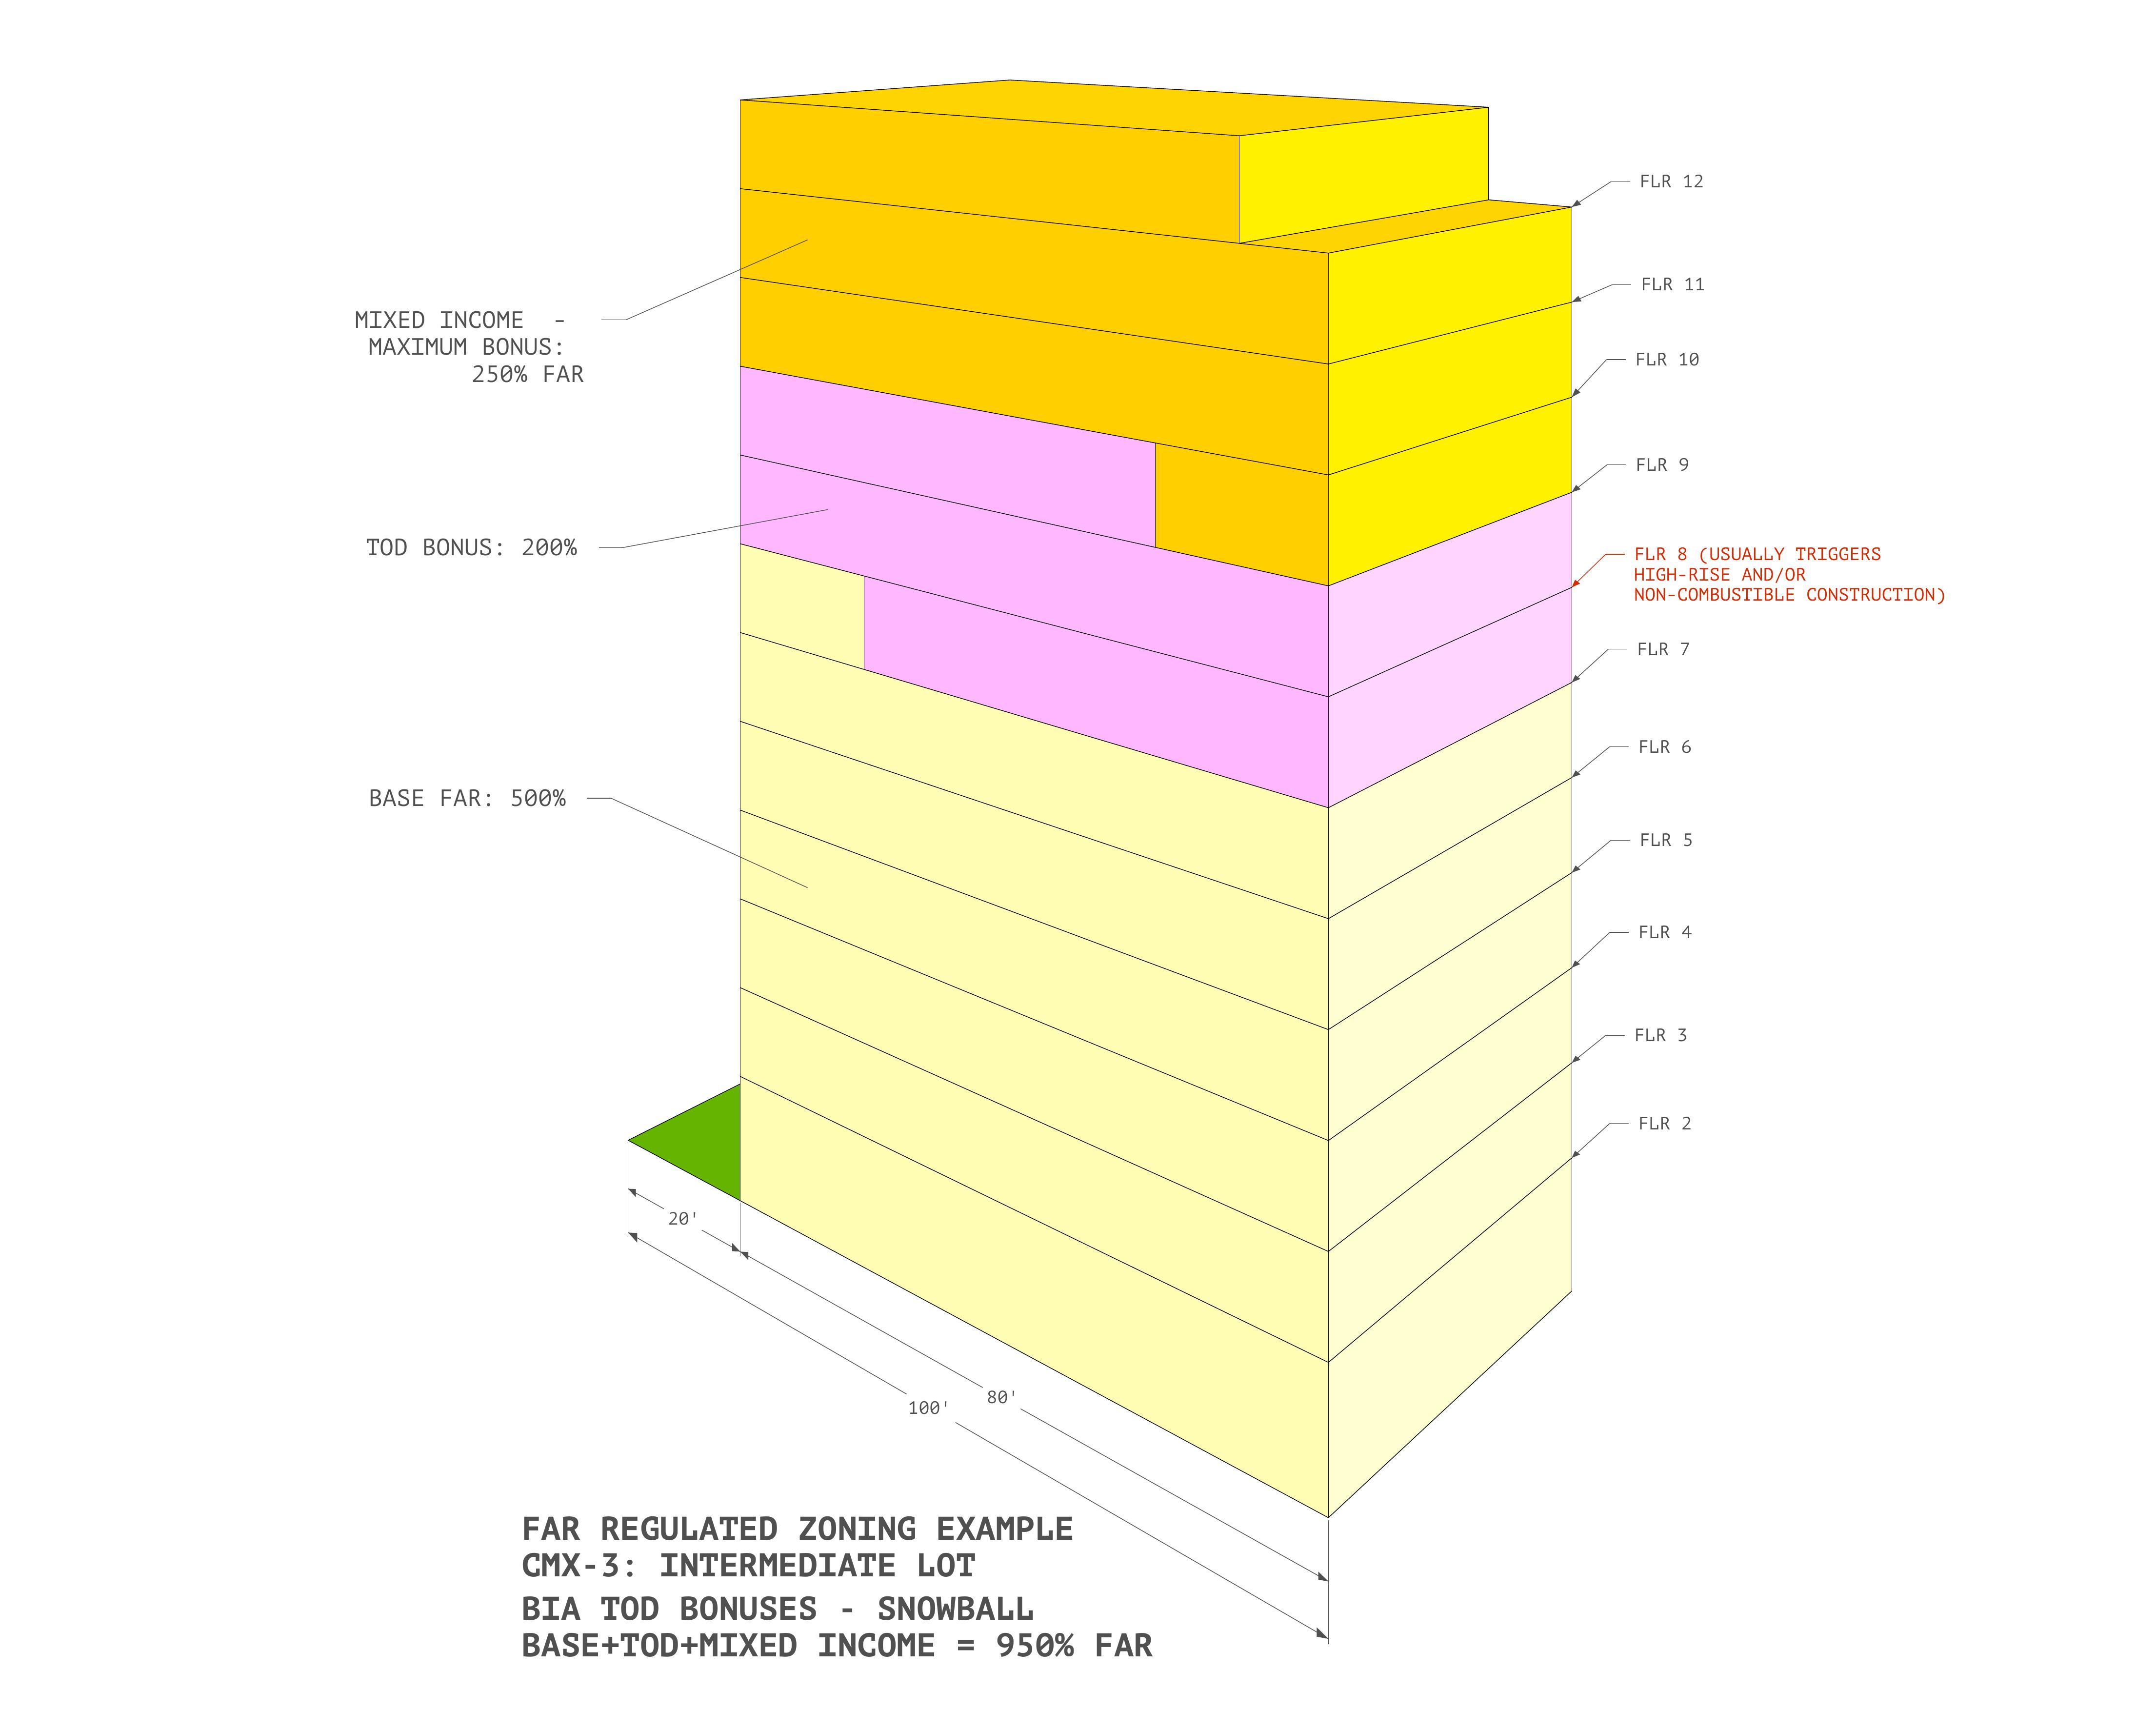
Stacking the doubled transit-improvements bonus (200%, Bill 260518) and the mixed-income bonus (250%, §14-702(7)) on the 500% base reaches 950% FAR. At 12+ stories with 80% lot coverage, the building clears the cost cliff and becomes economical again — but only if the developer earns both contingent bonuses. The by-right path stops short of that.
The Cost Cliff
At 650% FAR, buildings reach 9 stories, which requires Type I steel/concrete construction — about 32% more per square foot — while adding only about two floors over the 7-story wood-frame optimum. The economics are strongest either at 7 stories (wood frame) or at 12+ stories, where added floor area offsets the higher cost. The 8-9 story range in between is where the cost study finds the weakest returns.
Add More Stations
The Parker bill covers 13 MFL stations. Philadelphia has 38 more worth including.
Six transit corridors — the Broad Street Line, Girard Ave trolley, regional rail, and MFL gap stations — capture 10,843 additional eligible parcels across 38 new stations. Combined with the Parker bill, these corridors produce 33,144 realistic housing units — 3.6x what the Parker bill delivers alone.
| Corridor | Stations | Parcels | Near-term | Realistic | With MIN |
|---|---|---|---|---|---|
| Girard Ave (Rt 15 Trolley + BSL) | 11 | 3,519 | 9,731 | 7,956 | 7,835 |
| North Broad BSL | 11 | 2,143 | 9,445 | 7,662 | 7,662 |
| Complete MFL (Fill Gaps) | 5 | 2,364 | 5,516 | 4,775 | 4,196 |
| West Philadelphia RR | 3 | 1,370 | 2,150 | 1,875 | 1,838 |
| South Broad BSL | 6 | 1,377 | 1,862 | 1,536 | 1,536 |
| Chelten/Germantown RR | 2 | 70 | 232 | 231 | 231 |
The Stations We Want Added
Six corridors, 38 stations. We are asking each District Council Member to introduce companion amendments adding the stations in their district. Each card shows the corridor’s realistic near-term housing yield and the individual stations within it.
Girard Ave (Rt 15 Trolley + BSL)
11 stations- Girard & Front St+583
- Girard & 2nd St+1,364
- Girard & 5th St+2,136
- Girard & 8th St+747
- Girard BSL+464
- Girard & 16th St+763
- Girard & 17th St+642
- Girard & 33rd St+87
- Girard & 39th St+171
- Girard & 51st St+675
- Girard & 52nd St+324
North Broad BSL
11 stations- Temple University BSL+472
- Cecil B Moore BSL+26
- Susquehanna-Dauphin BSL+811
- North Philadelphia Amtrak+2,531
- Erie BSL+931
- Hunting Park BSL+446
- Wayne Junction RR+368
- Logan BSL+451
- Wyoming BSL+1,578
- Olney TC BSL+48
- Fern Rock TC BSL—
Complete MFL (Fill Gaps)
5 stations- Girard MFL+2,021
- York-Dauphin+1,203
- Church+435
- Margaret-Orthodox+452
- Arrott TC+664
West Philadelphia RR
3 stations- 30th Street Station+598
- 49th Street RR+153
- Overbrook RR+1,124
South Broad BSL
6 stations- Ellsworth-Federal BSL+937
- Tasker-Morris BSL+91
- Snyder BSL+193
- Oregon BSL+265
- AT&T Station BSL+50
- NRG Station BSL—
Chelten/Germantown RR
2 stations- Chelten Avenue RR—
- Germantown RR+231
Parker Alone vs. Combined
Eliminate Parking Minimums
Parking requirements consume floor area within a fixed height envelope, killing housing units.
In a 38-foot building — the maximum in most residential districts — requiring ground-floor parking eliminates an entire residential floor. Each parking space consumes roughly 350 sqft including drive aisles. Across all TOC-eligible parcels, current parking minimums destroy 10,545 housing units that could otherwise be built.
Units Lost to Parking by Scenario
Parking Rates by District (Zoning Code \u00a714-804)
1 space/unit: RM-3, RM-4, RSA-1, RSA-2, RSA-3, RTA-1
0.5 space/unit: RM-2
0.3 space/unit: CMX-3
No requirement: RM-1, CMX-1, CMX-2, CMX-2.5, CMX-4, CMX-5
The Parker bill reduces these by 50% but does not eliminate them. A 10-unit building in RSA-3 would still need 5 parking spaces — consuming 1,750 sqft that could hold 2 additional units.
The Full Picture
Each reform builds on the last. Together they transform the TOC overlay from modest to meaningful.
The Parker bill as introduced delivers an estimated 7,904 housing units. Five complementary reforms — funding or repealing the MIN overlay, fixing the construction cost cliff, expanding to 6 transit corridors, and eliminating parking minimums — bring the total to 46,582 units.
Cumulative Housing Yield by Reform
Each bar shows the individual policy contribution. Running total shown above each bar.
| Reform | Units Added | Running Total |
|---|---|---|
| Parker TOC (as introduced) | +7,904 | 7,904 |
| Fund or Repeal MIN | +2,566 | 10,470 |
| Remove Cost Cliff | +1,532 | 12,002 |
| 6-Corridor Expansion | +24,035 | 36,037 |
| Eliminate Parking Min. | +10,545 | 46,582 |
Pass the Bills. Add the Stations. End the Parking Minimums.
The TOC bills are a credible start. Council can make them meaningful by adding stations across all six corridors and eliminating parking minimums in the TOC overlay.
See Your District